
What Market Volatility Actually Means for Long-Term Investors

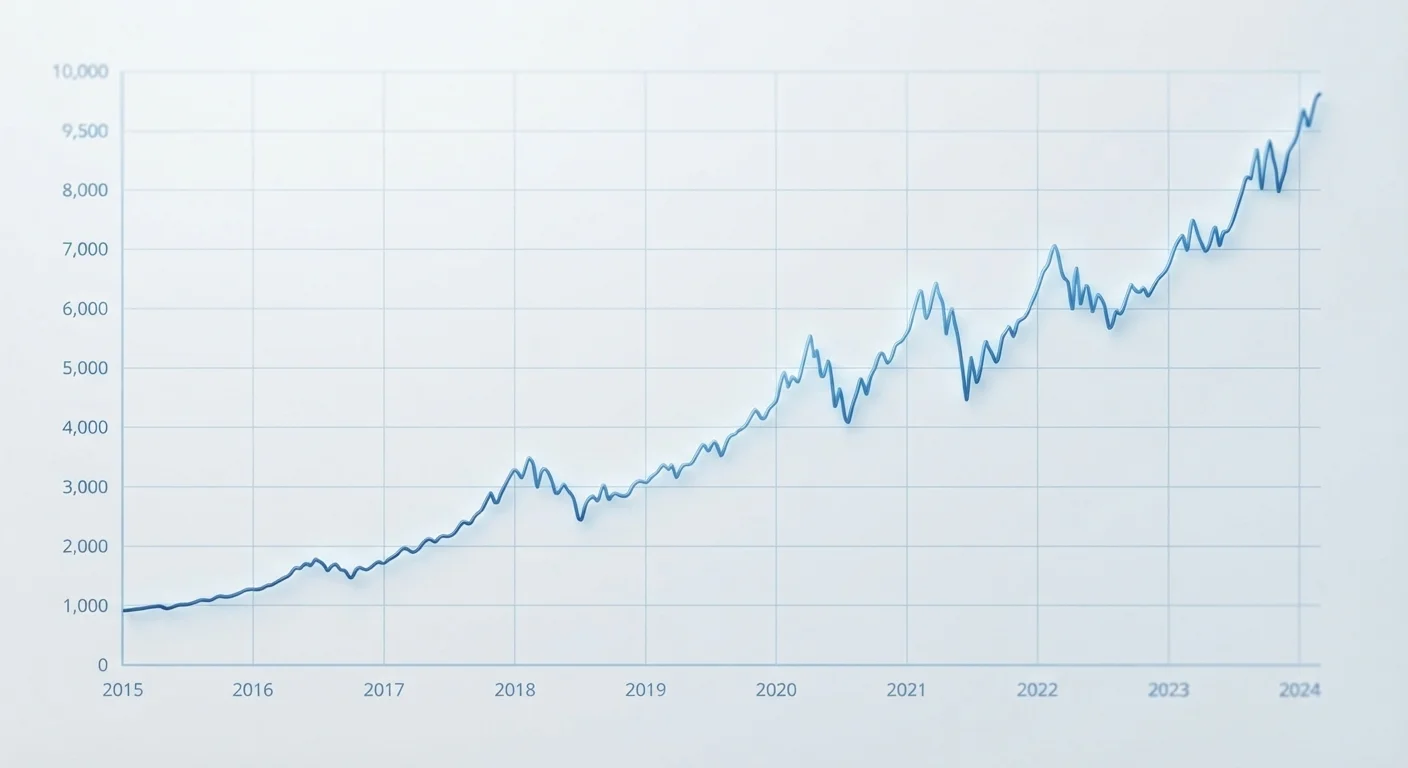
A calm, evidence-grounded explanation of price swings, why they are a normal part of markets, and how perspective shapes an investor's response.
Key takeaways
- Price swings are a built-in part of markets, not a sign that something has gone permanently wrong.
- Historically, broad stock market indexes have recovered from downturns over long enough time horizons, though past performance does not guarantee future results.
- Selling during a downturn locks in losses and removes the possibility of participating in a recovery.
- A long time horizon changes how much short-term volatility actually affects an investor's outcome.
- Behavior during volatile periods often matters more than the specific investments held.
Why prices move in the first place
Every price in a financial market reflects what buyers and sellers agree something is worth at that moment. That agreement shifts constantly as new information arrives: earnings reports, interest rate decisions, geopolitical events, changes in consumer demand. Because information arrives unpredictably, prices move unpredictably. That is not a flaw in the system. It is how markets process information.
For a newer investor, it can feel as though a falling market is a warning that something is broken. In most cases it is not. It is the normal mechanism by which prices adjust to a changed picture. Understanding what investing is at a foundational level makes this easier to accept, because you stop treating price movement as a verdict on your decisions and start treating it as noise around a longer trend.
What the data says about downturns
U.S. stock market history includes frequent and sometimes severe short-term declines. According to data from market research organizations, declines of 10% or more (commonly called corrections) have occurred roughly once per year on average over long historical periods. Declines of 20% or more (bear markets) have been less frequent but still regular.
What the same data also shows is that broad market indexes have, over multi-decade periods, recovered from each of those downturns and gone on to new highs. Past performance does not guarantee future results, and no one can promise any specific recovery will happen or on what timeline. But the pattern is consistent enough that professional financial planners generally treat long-term participation in diversified markets as the baseline, not an aggressive move.
~1 per year
Average frequency of 10%+ market corrections (U.S. stocks, historical)
Based on long-run historical data from U.S. equity market indexes tracked by financial research organizations.
14 of 20
Calendar years the S&P 500 finished positive (2000-2019)
S&P 500 annual return data compiled by financial data providers shows positive years have outnumbered negative ones across most multi-decade windows, though no future pattern is guaranteed.
The length of your time horizon matters more than any single downturn. An investor with 30 years before retirement experiences a 20% decline very differently than someone planning to withdraw funds in two years. Compounding works the same way: time is the variable that changes the math.
The behavior problem
Research in behavioral finance has documented a consistent pattern: investors tend to sell after prices have already fallen and buy after prices have already risen. This sequence, repeated over time, produces returns below what the market itself delivered over the same period. The gap between what a market returned and what the average investor in that market actually received is sometimes called the behavior gap.
Panic-selling during a downturn does two things. It turns an unrealized loss into a real one. It also removes you from the market at exactly the point when holding has historically been most valuable, because recoveries often happen in short, sharp bursts that are easy to miss. The emotional side of investing covers the cognitive patterns that make staying put feel harder than it actually is.
Practical ways to manage your response to volatility
The goal is not to eliminate discomfort. Some discomfort during a downturn is reasonable. The goal is to avoid taking actions during that discomfort that hurt your long-term position.
A few approaches that financial planners commonly discuss with clients:
- Write down your investment goals and time horizon before a downturn happens, so you have a reference point when emotions are elevated.
- Avoid checking your portfolio balance daily during volatile periods. Frequency of checking increases anxiety without providing useful information for a long-term investor.
- Understand your asset allocation before a decline, so a drop does not come as a shock. Portfolio rebalancing is one tool for keeping that allocation aligned with your goals over time.
- Consider whether your allocation actually matches your real risk tolerance, not the one you imagined when prices were rising.
None of these steps requires predicting the market. They require knowing yourself and having a plan written down before the noise starts.
This article is for general informational and educational purposes only and is not personalized financial or investment advice. Past market performance does not guarantee future results. Consult a qualified, licensed financial adviser before making decisions based on your own circumstances.
Frequently Asked Questions
The content on this site is for informational purposes only and is not a substitute for professional advice. Always consult a qualified professional for guidance specific to your situation.